Introduction:
For optimum protection from surges and noise, the goal is to keep the surge energy from exceeding the normal power wave region. As the surge energy travels, the sudden rise of voltage (dV/dt) and current (dI/dt) is what causes the degradation of sensitive electronics. We will show you how Series Mode Filter Technology compares to MOV products while being subjected to surge energy. The following actual oscillograms dramatically demonstrate the superior surge suppression of WVR filters when compared with conventional surge protectors.
Test Method:
Using an oscilloscope, one can look at the voltage as it changes in real time and take a snap shot. To catch the surge as it travels through the test circuit, the oscilloscope triggers the probe measurement to take place during a window of time while the surge is passing by. North American 120 volt power oscillates between +170 and -170 volts. We call the power to have 120 volts because it is the peak voltage divided by the square root of 2 (170 / 1.414 ≈ 120). The time it takes to complete one cycle is 1/60 of a second because power oscillates at 60 Hz. There are 16,667 microseconds in one cycle. Surges happen within one cycle. The standard IEEE C62.41 test surge is a combination wave of energy of 6000 volts / 3000 amps that lasts 50 microseconds.
Test Subjects:
Zero Surge Product – the following tests were performed using our 15 amp products. The other current rated products perform in the same manner with the same type of results relative to their rated current.
Competition – a typical plug in MOV protector and a whole building MOV protector are tested.
Results:
Comparing Plug-in Products

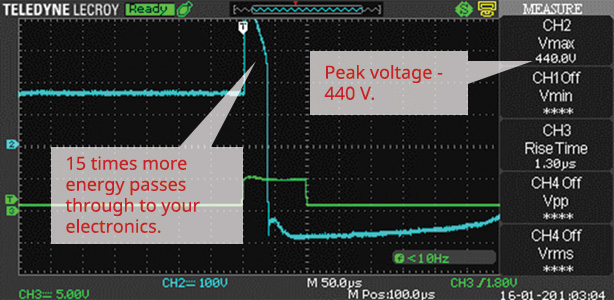
Figure 1: MOV Plug In Protector
The MOV plug in protector’s response is represented by the blue line. There are three interesting features from this oscillogram:
- The peak voltage is 440 volts. Industry standards recommend keeping below 330 volts. This is what is considered the Voltage Protection Rating (VPR) or clamping voltage or let through voltage.
- The rise of the blue line is straight up. This means the dV/dt is very large which represents a sudden increase of voltage. This is like a shock to sensitive electronics.
- The total area under the blue line represents the energy that was allowed to pass through to your electronics above the normal power wave. In this oscillogram, the total energy passed through is 15 times greater than what a Zero Surge product would pass.

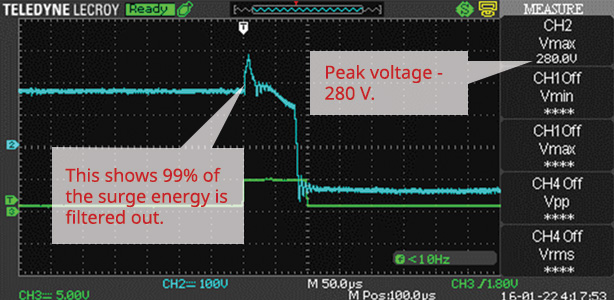
Figure 2: Zero Surge Plug In Protector
With the Zero Surge Plug In protector, you can see how the three key features have improved greatly.
- The peak voltage is 280 volts. This falls within the 330 volts VPR lower limit set by UL. No company can claim lower than a 330 volt rating but we can show the true oscilloscope readings.
- The scale is difficult to read but you can see that the slope of the rise in voltage has some lean to it. That shows the lower dV/dt that Series Mode Filter Technology can offer.
- The total area of the curve shows that 99% of the total surge energy was filtered out.
Comparing Whole Building MOV Protection

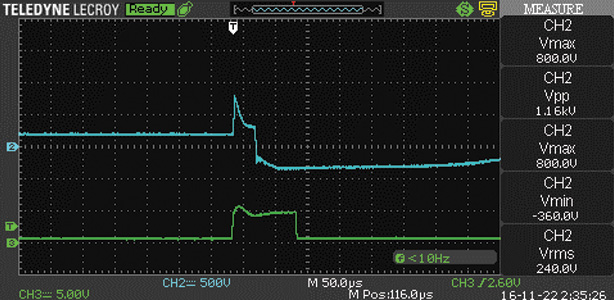
Figure 3: MOV Whole Building Surge Protector

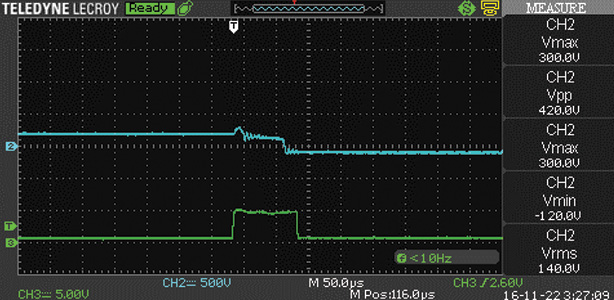
Figure 4: Zero Surge FF1-20-120W Facility Filter
As we have said in other papers and literature, we believe that using a whole building surge protector will help very little to protect your sensitive electronics. The companies that offer this type of protection will say that you need to have layers of protection. This is because an MOV based plug-in protector will perform at best as shown in Figure 1. They will degrade rapidly if the building voltage exceeds 127 volts for any length of time or if large surges occur. But as you can see from Figure 1, there are other issues with the value of protection that they provide.
Conclusions:
It is clear from the testing that MOV surge protection is not complete protection. It lacks in protecting from the sudden increase in voltage, the peak voltage can vary by type of product, and the total amount of energy passed through is too high. Zero Surge Series Mode Filter Technology addresses these components as well as the current rise, durability, reliability, and does not degrade over time.
